I had the good fortune to participate in a conversation about how policies can create positive outcomes for racial integration. The American University Center for Latin American and Latino Studies hosted the event that included nationally renowned scholars and policymakers from the District. I was invited to talk and took the opportunity to provide a context for the DC area.
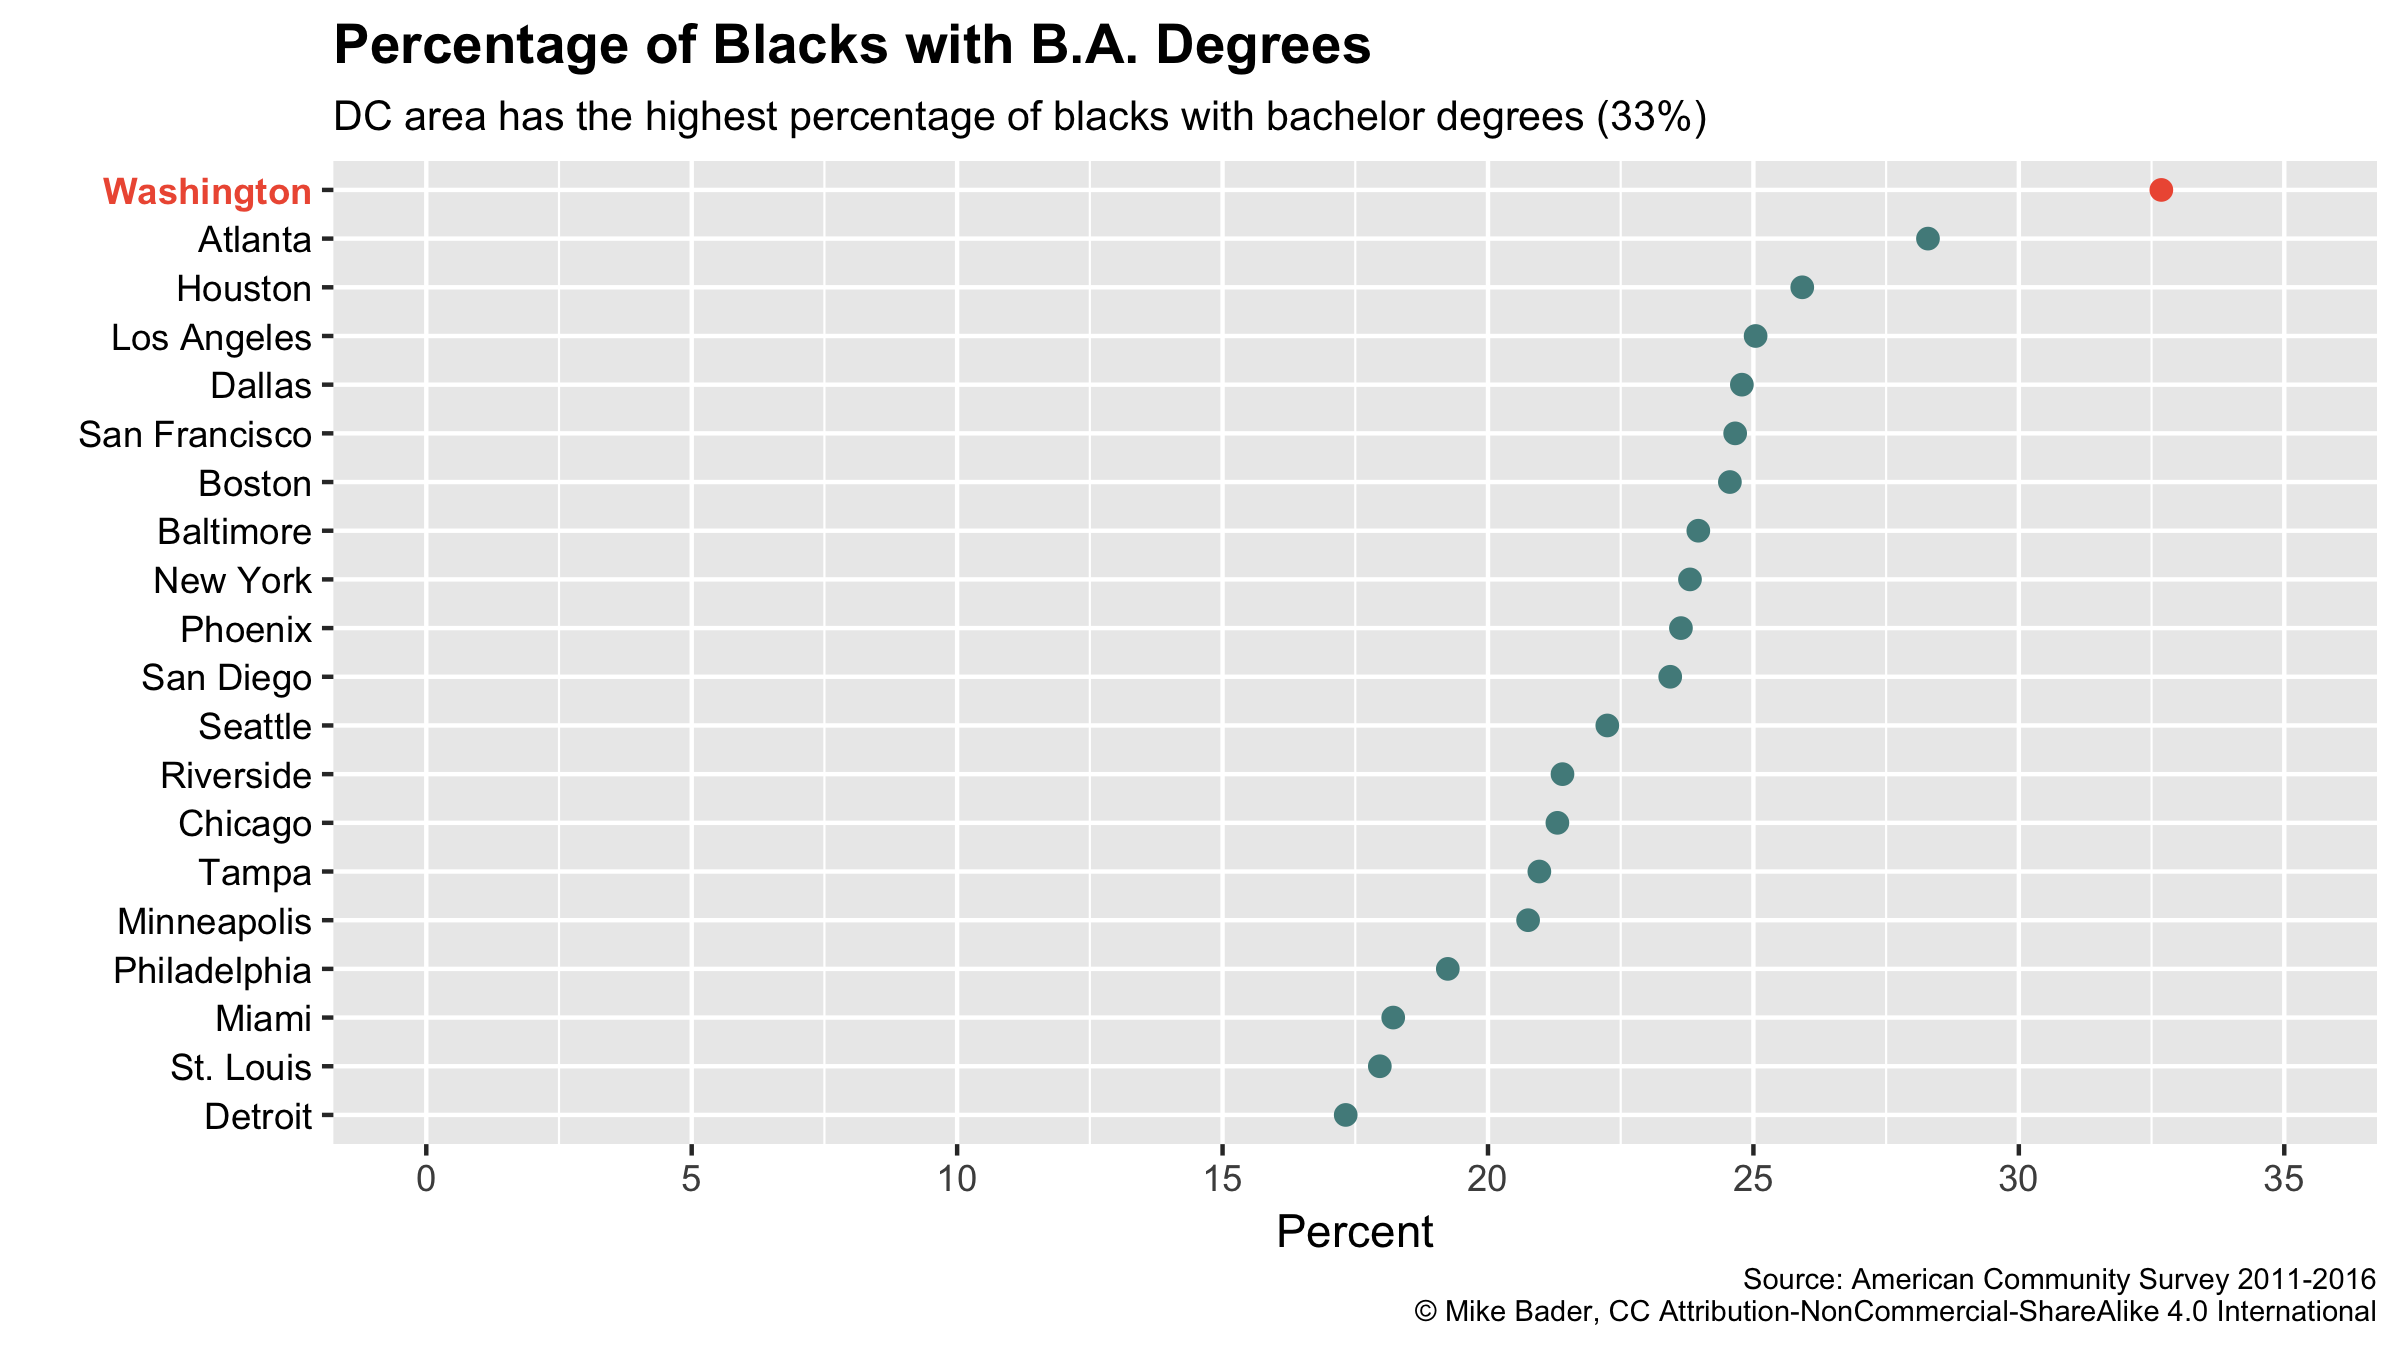
I emphasized three major points in my talk. First, race and class are not synonymous in the DC area. A higher percentage of blacks in the DC area have college degrees than any other metropolitan area in the country. A third of DC-area blacks have a college degree. The share of blacks with college degrees in the next closest metropolitan area, Atlanta, was over four points less than DC.
Stark racial disparities exist in the DC area, however. While a third of blacks have obtained a college degree, nearly twice that percentage of whites, 61%, have obtained a college degree. Asians have obtained degrees at a similar level as whites. Latinx residents, however, had the lowest share of college graduates with only about one in four having graduated from college.

While immigration can explain much of the education gap for Latinx residents, immigration does not correlate with educational attainment as highly as it does in other metropolitan areas. The plot below shows the distribution of educational attainment for foreign-born residents shaded in pink. The distribution is virtually flat across levels of educational attainment (the blue area shows the distribution of US-born residents). The dashed pink line shows the average distribution of educational attainment of foreign-born residents in the 20 largest metropolitan areas (the dashed blue line represents the average for those same metros).
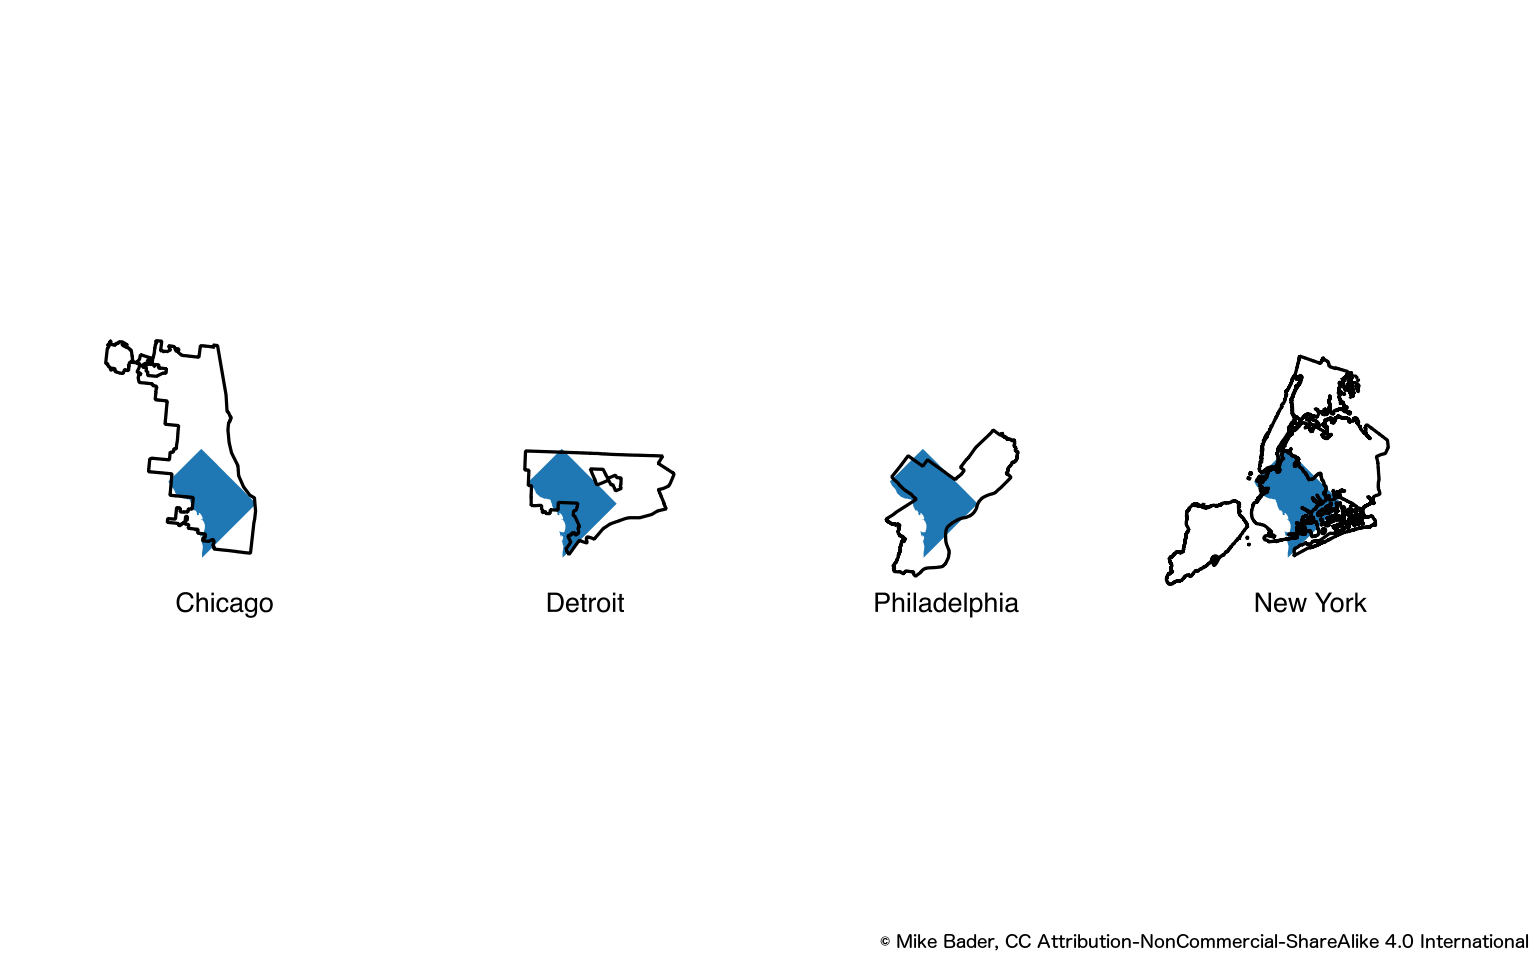
The second point that I made was that DC is small. As in its geographic area. The District covers about 68 square miles. To provide some context for the size of cities in the DC area, I showed the figure below to indicate the relative size of DC. It covers roughly the same area as the South Side of Chicago, the West Side of Detroit, West and Center City Philadelphia, and differs from Brooklyn by a single square mile.
DC cannot build up like other small geographic entities. Congress limits the height of most buildings in the District to 13 stories. With the development that has occurred in DC in the past decade, space has become a scarce commodity and change to that space becomes even more contentious.
<a href="https://mdmb-mbweb.s3.amazonaws.com/media/images/DCAS2016SampleNeighborhoods.png"

The city's small size requires, in my view, a regional approach to sharing space. The map below shows two types of neighborhoods: quadrivial neighborhoods in which whites, blacks, Latinos, and Asians each make up ten percent of the tract population and in which no group makes up a majority, and disproportionately Latino in which at least 20% of residents were Latino (and the neighborhood was not already classified as a quadrivial neighborhood). Many of the places where racial groups share space exist in the suburban counties surrounding the District.
Inspired by the stunning work of Aaron Williams and Armand Emamdjomeh at the Washington Post, I made dot plots (not as nice as theirs) of race in the DC area since 1980. These maps show the profound changes that have occurred, particularly in middle-ring suburbs like Germantown, Annandale, and Herndon. All-white areas have grown in population and simultaneously become more diverse, repeating patterns that Siri Warkentein and I have previously noted in other metropolitan areas.

At the same time, the metropolitan area as a whole remains racially segregated. The maps show the reduction in the number of whites living in the outer reaches of Prince George's county during the 1980s and 1990s as the number of blacks grew. The maps also show the expansion of Latinos along the University Avenue corridor stretching from Wheaton through Langley Park onto College Park.

I ended on somewhat of a down note by showing results from the [2016 DC Area Survey][dcas2016]: fear of police officers shaped their everyday lives. More than half of both blacks and Latinos shared that the fear of arrest or questioning of their loved ones by the police affected their daily lives at least a little bit, and most said a lot. The survey was in the field in May of 2016, before Trump had even locked up the Republican presidential nomination! We are going back in the field next month to explore these results even further.

Comments
Comments are closed.